Course Content
Chapter 01 – Sets
A set is a list of objects in no particular order; they could be numbers, letters, or even words. A Venn diagram is a way of representing sets visually.
0/7
Chapter 02 – Rational Numbers
In mathematics, a rational number is a number that can be expressed as the quotient or fraction p/q of two integers, a numerator p, and a non-zero denominator q. In this chapter, we will learn to represent rational numbers on a number line and perform arithmetic operations.
0/5
Chapter 03 – Decimals
Decimals are a set of numbers lying between integers on a number line. They are just another way to represent fractions in mathematics. In this chapter, we will learn about the conversion of decimals to rational numbers, the kinds of decimals, and absolute values.
0/6
Chapter 04 – Exponents
The exponent of a number says how many times to use that number in a multiplication. The laws of exponents simplify the multiplication and division operations and help to solve the problems easily. In this chapter, we are going to discuss the six important laws of exponents.
0/4
Chapter 05 – Square Root of Positive Numbers
Square root, in mathematics, is a factor of a number that, when multiplied by itself, gives the original number. In this chapter, we will learn about what makes perfect squares and will find the roots of positive numbers by considering real-life scenarios.
0/4
Chapter 06 – Direct and Inverse Variation
Variation means change. With direct variation, numbers change proportionately in the same direction, while with inverse variation, they change in opposite directions. In this chapter, we will earn how to solve direct and inverse variation problems, explore their definitions, and work examples to understand the equations and techniques for solving them. Also, we learn to find the continued ratio for two or more ratios.
0/9
Chapter 07 – Financial Arithmetic
Financial mathematics describes the application of mathematics and mathematical modeling to solve financial problems. In this chapter, we will learn about the concept of taxation, profit/markups, zakat & ushr, and how they relate to our daily life.
0/7
Chapter 08 – Algebraic Expressions
Algebraic expressions are the idea of expressing numbers using letters or alphabets without specifying their actual values. The algebraic equations which are valid for all values of variables in them are called algebraic identities. In this chapter, we will learn to perform operations on polynomials and to factorize an algebraic equation by using identities.
0/10
Chapter 09 – Linear Equations
Linear equations are equations having variables with power 1. ax+b = 0 is an example with one variable where x is the variable, and a and b are real numbers. In this chapter, we will learn the definition, type of solutions, and how to solve these equations with one variable and two variables using different methods along with examples.
0/10
Chapter 10 – Fundamentals of Geometry
Geometry is the study of different types of shapes, figures, and sizes in Maths or real life. In geometry, we learn about different angles, transformations, and similarities in the figures. It is important to know and understand some basic concepts. We will learn about working in different numbers of dimensions, and about some of the most fundamental concepts in geometry, including points, lines, and planes.
0/7
Chapter 11 – Practical Geometry
The practical Geometry chapter will teach you about lines and to construct two-dimensional given different kinds of measurements. A quadrilateral is a closed two-dimensional shape that has four sides and four angles. Any four-sided closed shape such as square, rectangle, rhombus, parallelogram, trapezium, etc. And a closed two-dimensional shape that has 3 sides and 3 angles is known as a triangle.
0/16
Chapter 12 – Circumference, Area and Volume
This topic comes under analytical geometry and the formulas for the volume and the surface area of the sphere were first discovered by Archimedes. In this chapter, we will learn about the area and volume of two-dimensional and three-dimensional shapes.
0/6
Chapter 13 – Information Handling
Frequency distribution, in statistics, is a graph or data set organized to show the frequency of occurrence of each possible outcome of a repeatable event observed many times. And, a pie chart is a way of representing data in a circular graph. Pie slices of the chart show the relative size of the data. In this chapter, we will learn to construct the frequency distribution table, some new pie chart vocabulary, and learn to construct the pie chart to represent the data.
0/5
Grade 7 – Mathematics
About Lesson

Direct Proportion

Direct proportion is a mathematical comparison between two numbers where the ratio of the two numbers is equal to a constant value. The proportion definition says that when two ratios are equivalent, they are in proportion. The symbol used to relate the proportions is “∝”.

“When the relationship between two quantities is such that if we increase one, the other will also increase, and if we decrease one the other quantity will also decrease, then the two quantities are said to be in a direct proportion”.

For example, if there are two quantities x and y where x = number of candies and y = total money spent. If we buy more candies, we will have to pay more money, and we buy fewer candies then we will be paying less money. So, here we can say that x and y are directly proportional to each other. It is represented as x ∝ y. Direct proportion is also known as direct variation.

Some real-life examples of direct proportionality are given below:

  • The number of food items is directly proportional to the total money spent.
  • Work done is directly proportional to the number of workers.
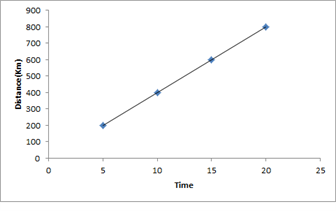
  • Speed is in direct proportion to the distance w.r.t a fixed time.

In our day-to-day life, we observe that the variations in the values of various quantities depending upon the variation in values of some other quantities.

Direct Proportion

For example: if the number of individuals visiting a restaurant increases, earning of the restaurant also increases and vice versa. If more number of people are employed for the same job, the time taken to accomplish the job decreases.

Sometimes, we observe that the variation in the value of one quantity is similar to the variation in the value of another quantity that is when the value of one quantity increases then the value of other quantity also increases in the same proportion and vice versa. In such situations, two quantities are termed to exist in direct proportion.

Direct Proportion - GCSE Maths - Steps, Examples & Worksheet

Direct Proportion Symbol and Constant of Proportionality

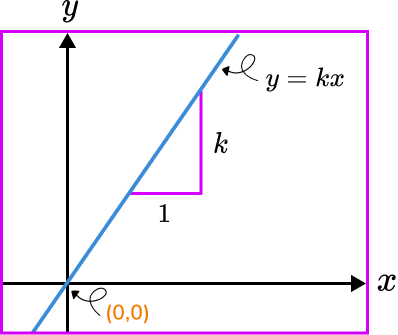
The symbol for “direct proportional” is ‘∝’  (One should not confuse with the symbol for infinity ∞). Two quantities existing in direct proportion can be expressed as;

x ∝ y

x/y = k

x = ky

k is a non-zero constant of proportionality.

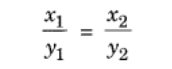
Where x and y are the value of two quantities and k are a constant known as the constant of proportionality. If x1, y1 is the initial values and x2, y2 are the final values of quantities existing in direct proportion. They can be expressed as,

Example:
A recipe for 6 cupcakes needs 1 cup of flour. The number of cupcakes you can make varies directly with the amount of flour, which means for making more cup cakes we require more flour. How many cupcakes can you make with 4 cups of flour? 

Solution:

Let  = amount of flour and  = number of cupcakes 

Since 

     . . . (

For  cup cakes we require  cup of flour. 

 for 

put the above values in equation (


   . . . (

Now we have to find the number cup cakes that can be made in four cups of flour.

When  

Using equation ()

So you can make  cupcakes in  cups of flour.

Example:

An electric pole, 7 meters high, casts a shadow of 5 meters. Find the height of a tree that casts a shadow of 10 meters under similar conditions.

Solution:

Let the height of the tree be x meters. We know that if the height of the pole increases the length of shadow will also increase in same proportion. Hence, we observe that the height of the tree and the length of its shadow exist in direct proportion. In other words height of pole is directly proportional to the length of its shadow. Thus,

x1 / y1 =  x2 / y2
7 / 5 = x / 10
x = 14 meters.
 
Example:

A train travels 200 km in 5 hours. How much time it will take to cover 600 km?

Solution:

Let the time taken be T hours.

We know that time taken is directly proportional to distance covered.

Hence,

x1 / y1 = x2 / y2
⇒ 200 / 5 = 600 / T
T = 15 hours.
Direct proportion Answer
Exercise Files
RatioProportionProblems.pdf
Size: 64.98 KB
Find Missing Proportions.pdf
Size: 106.03 KB
0% Complete