Course Content
Chapter 01 – Sets
A set is a list of objects in no particular order; they could be numbers, letters, or even words. A Venn diagram is a way of representing sets visually.
0/7
Chapter 02 – Rational Numbers
In mathematics, a rational number is a number that can be expressed as the quotient or fraction p/q of two integers, a numerator p, and a non-zero denominator q. In this chapter, we will learn to represent rational numbers on a number line and perform arithmetic operations.
0/5
Chapter 03 – Decimals
Decimals are a set of numbers lying between integers on a number line. They are just another way to represent fractions in mathematics. In this chapter, we will learn about the conversion of decimals to rational numbers, the kinds of decimals, and absolute values.
0/6
Chapter 04 – Exponents
The exponent of a number says how many times to use that number in a multiplication. The laws of exponents simplify the multiplication and division operations and help to solve the problems easily. In this chapter, we are going to discuss the six important laws of exponents.
0/4
Chapter 05 – Square Root of Positive Numbers
Square root, in mathematics, is a factor of a number that, when multiplied by itself, gives the original number. In this chapter, we will learn about what makes perfect squares and will find the roots of positive numbers by considering real-life scenarios.
0/4
Chapter 06 – Direct and Inverse Variation
Variation means change. With direct variation, numbers change proportionately in the same direction, while with inverse variation, they change in opposite directions. In this chapter, we will earn how to solve direct and inverse variation problems, explore their definitions, and work examples to understand the equations and techniques for solving them. Also, we learn to find the continued ratio for two or more ratios.
0/9
Chapter 07 – Financial Arithmetic
Financial mathematics describes the application of mathematics and mathematical modeling to solve financial problems. In this chapter, we will learn about the concept of taxation, profit/markups, zakat & ushr, and how they relate to our daily life.
0/7
Chapter 08 – Algebraic Expressions
Algebraic expressions are the idea of expressing numbers using letters or alphabets without specifying their actual values. The algebraic equations which are valid for all values of variables in them are called algebraic identities. In this chapter, we will learn to perform operations on polynomials and to factorize an algebraic equation by using identities.
0/10
Chapter 09 – Linear Equations
Linear equations are equations having variables with power 1. ax+b = 0 is an example with one variable where x is the variable, and a and b are real numbers. In this chapter, we will learn the definition, type of solutions, and how to solve these equations with one variable and two variables using different methods along with examples.
0/10
Chapter 10 – Fundamentals of Geometry
Geometry is the study of different types of shapes, figures, and sizes in Maths or real life. In geometry, we learn about different angles, transformations, and similarities in the figures. It is important to know and understand some basic concepts. We will learn about working in different numbers of dimensions, and about some of the most fundamental concepts in geometry, including points, lines, and planes.
0/7
Chapter 11 – Practical Geometry
The practical Geometry chapter will teach you about lines and to construct two-dimensional given different kinds of measurements. A quadrilateral is a closed two-dimensional shape that has four sides and four angles. Any four-sided closed shape such as square, rectangle, rhombus, parallelogram, trapezium, etc. And a closed two-dimensional shape that has 3 sides and 3 angles is known as a triangle.
0/16
Chapter 12 – Circumference, Area and Volume
This topic comes under analytical geometry and the formulas for the volume and the surface area of the sphere were first discovered by Archimedes. In this chapter, we will learn about the area and volume of two-dimensional and three-dimensional shapes.
0/6
Chapter 13 – Information Handling
Frequency distribution, in statistics, is a graph or data set organized to show the frequency of occurrence of each possible outcome of a repeatable event observed many times. And, a pie chart is a way of representing data in a circular graph. Pie slices of the chart show the relative size of the data. In this chapter, we will learn to construct the frequency distribution table, some new pie chart vocabulary, and learn to construct the pie chart to represent the data.
0/5
Grade 7 – Mathematics
About Lesson

Math Lab Activity

– Get the Angle on Pool 

Objective:

To practice identifying and drawing polygons on a pool table while understanding the concepts of acute, obtuse, and right angles.


Materials Needed:

  • Reproducible worksheet “Get the Angle on Pool”
  • Colored pencils or markers
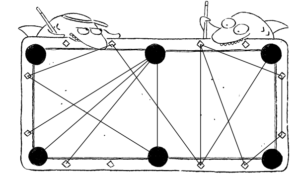
  • Pool table diagram (provided by the teacher)
  • Ruler (optional)


Introduction to Polygons and Angles:
Today, we will be exploring polygons and angles on a pool table. First, let’s review some important concepts:

  • Polygon: A polygon is a closed shape with straight sides. It can have three or more sides. Some examples of polygons are triangles, quadrilaterals (like rectangles and squares), pentagons, hexagons, and more.
  • Angle: An angle is formed when two lines meet or intersect. We can classify angles based on their measures:

    – Acute Angle: An acute angle measures between 0 and 90 degrees.
    – Obtuse Angle: An obtuse angle measures between 90 and 180 degrees.
    – Right Angle: A right angle measures exactly 90 degrees.

– Polygons on the Pool Table: You will be drawing polygons on the pool table using the corners formed by the 6 pockets or the 12 diamond markings.

Instructions:


Drawing Polygons on the Pool Table:
– Print the “Get the Angle on Pool” reproducible worksheet.
– On the pool table diagram provided on the worksheet, draw polygons by connecting the corners formed by the pockets or diamond markings.
– Use different colored pencils or markers to distinguish between the types of polygons and angles.
– Aim to draw as many different polygons as you can, making sure to include a variety of sides (triangles, quadrilaterals, etc.).
– Pay attention to the angles formed by the sides of your polygons. Classify them as acute, obtuse, or right angles based on their measures.


Sample Polygon and Angle:
Here’s an example to get you started:
– Draw a triangle by connecting any three corners on the pool table.
– Label the angles within the triangle as acute, obtuse, or right based on their measurements.

Exploring Different Polygons:
– Experiment with drawing various polygons on the pool table using different corners.
– Remember to classify the angles within each polygon as acute, obtuse, or right.


Know Your Polygons! (Optional):
– Take a look at the “Know Your Polygons!” box on the worksheet.
– Try to draw polygons that match the descriptions and examples provided in the box.


Have fun exploring polygons and angles on the pool table! Use your creativity and observation skills to draw and identify as many different polygons and angles as possible.


Ignite Your Mathematical Mind:
Let Your Logical Thinking Unleash to Explore the World of Wonders!
  • Once you’ve drawn and labeled several polygons on the pool table, take a moment to reflect on the different types of angles you encountered.
  • Discuss what you’ve learned about polygons and angles during this activity.
Exercise Files
Activity Sheet – Get the Angle on Pool.pdf
Size: 57.75 KB
0% Complete