Course Content
Chapter 01 – Operations on Sets
The set operations are performed on two or more sets to obtain a combination of elements as per the operation performed on them. In a set theory, there are three major types of operations performed on sets, such as: Union of sets (∪) The intersection of sets (∩) Difference of sets ( – ) In this lesson we will discuss these operations along with their Venn diagram and will learn to verify the following laws: Commutative, Associative, Distributive, and De-Morgans' law.
0/13
Chapter 02 – Real Numbers
All real numbers follow three main rules: they can be measured, valued, and manipulated. Learn about various types of real numbers, like whole numbers, rational numbers, and irrational numbers, and explore their properties. In this chapter, we will learn about Squares and cubes of real numbers and find their roots.
0/5
Chapter 03 – Number System
The number system or the numeral system is the system of naming or representing numbers. There are different types of number systems in Mathematics like decimal number system, binary number system, octal number system, and hexadecimal number system. In this chapter, we will learn different types and conversion procedures with many number systems.
0/13
Chapter 04 – Financial Arithmetic
Financial mathematics describes the application of mathematics and mathematical modeling to solve financial problems. In this chapter, we will learn about partnership, banking, conversion of currencies, profit/markup, percentage, and income tax.
0/10
Chapter 05 – Polynomials
In algebra, a polynomial equation contains coefficients, exponents, and variables. Learn about forming polynomial equations. In this chapter, we will study the definition and the three restrictions of polynomials, we'll tackle polynomial equations and learn to perform operations on polynomials, and learn to avoid common mistakes.
0/6
Chapter 06 – Factorization, Simultaneous Equations
In algebra, factoring is a technique to simplify an expression by reversing the multiplication process. Simultaneous Equations are a set of two or more algebraic equations that share variables and are solved simultaneously. In this chapter, we will learn about factoring by grouping, review the three steps, explore splitting the middle term, and work examples to practice verification and what simultaneous equations are with examples. Find out how to solve the equations using the methods of elimination, graphing, and substitution.
0/10
Chapter 07 – Fundamentals of Geometry
Geometry is the study of different types of shapes, figures, and sizes. It is important to know and understand some basic concepts. We will learn about some of the most fundamental concepts in geometry, including lines, polygons, and circles.
0/4
Chapter 08 – Practical Geometry
Geometric construction offers the ability to create accurate drawings and models without the use of numbers. In this chapter, we will discover the methods and tools that will aid in solving math problems as well as constructing quadrilaterals and right-angled triangles.
0/3
Chapter 09 – Areas and Volumes
The volume and surface area of a sphere can be calculated when the sphere's radius is given. In this chapter, we will learn about the shape sphere and its radius, and understand how to calculate the volume and surface area of a sphere through some practice problems. Also, we will learn to use and apply Pythagoras' theorem and Herons' formula.
0/5
Chapter 10 – Demonstrative Geometry
Demonstrative geometry is a branch of mathematics that is used to demonstrate the truth of mathematical statements concerning geometric figures. In this chapter, we will learn about theorems on geometry that are proved through logical reasoning.
0/5
Chapter 11 – Trigonometry
Sine and cosine are basic trigonometric functions used to solve the angles and sides of triangles. In this chapter, we will review trigonometry concepts and learn about the mnemonic used for sine, cosine, and tangent functions.
0/6
Chapter 12 – Information Handling
Frequency distribution, in statistics, is a graph or data set organized to show the frequency of occurrence of each possible outcome of a repeatable event observed many times. Measures of central tendency describe how data sets are clustered in a central value. In this chapter, we will learn to construct the frequency distribution table, and learn more about three measures of central tendency, its importance, and various examples.
0/7
Grade 8 – Mathematics
About Lesson

What is a Venn Diagram?

A Venn diagram is an illustration that uses circles to show the relationships among things or finite groups of things. Circles that overlap have a commonality while circles that do not overlap do not share those traits.

Venn diagrams help to visually represent the similarities and differences between two concepts. 

Understanding Venn Diagrams

Venn diagrams are useful for illustrating how different concepts or factors intersect with one another. They can show, at a glance, how things are similar or different and where and how they overlap. Often, the center of a Venn diagram (the intersection of two or more circles) represents some nexus or main idea that can be decomposed into the various other circles, with labels on the outer portions more general and distinct ideas than those toward the center.

The overlapping areas can also be used to show where two otherwise disparate contexts share commonalities. For instance, in the example diagram below we see that while the urban and rural contexts are distinct with their own set of activities, they also do share sporting events.

set 2 venn diagram

Venn Diagram in Math

A Venn diagram in math is used in logic theory and set theory to show various sets or data and their relationship with each other.

How do you read a Venn Diagram?

A Venn diagram is read by observing all of the circles that make up the entire diagram. Each circle is its own item or data set. The portions of the circles that overlap indicate the areas that are in common amongst the different items whereas the parts that do not overlap indicate unique traits among the item or data set represented by the circle.

Why Are They Called Venn Diagrams?

They are called Venn diagrams because the diagram was developed by John Venn, an English logician.

What Is the Middle of a Venn Diagram Called?

The middle of a Venn diagram where two or more sets overlap is known as the intersection.

Does a Venn Diagram Always Use 2 or 3 Circles?

While often employing a pair or triplet of circles, Venn diagram can use any number of circles (or any other shape) to show the differences and intersections of different sets.

set 2 venn diagram

Example Venn diagram

Say our universe is pets, and we want to compare which type of pet our family might agree on.

Set A contains my preferences: dog, bird, hamster.

Set B contains Family Member B’s preferences: dog, cat, fish.

Set C contains Family Member C’s preferences: dog, cat, turtle, snake.

The overlap, or intersection, of the three sets contains only dog. Looks like we’re getting a dog.

Of course, Venn diagrams can get a lot more involved than that, as they are used extensively in various fields.

simple venn diagram

Venn diagram purpose and benefits

  • To visually organize information to see the relationship between sets of items, such as commonalities and differences. Students and professionals can use them to think through the logic behind a concept and to depict the relationships for visual communication. This purpose can range from elementary to highly advanced.
  • To compare two or more choices and clearly see what they have in common versus what might distinguish them. This might be done for selecting an important product or service to buy.
  • To solve complex mathematical problems. Assuming you’re a mathematician, of course.
  • To compare data sets, find correlations and predict probabilities of certain occurrences.
  • To reason through the logic behind statements or equations, such as the Boolean logic behind a word search involving “or” and “and” statements and how they’re grouped.
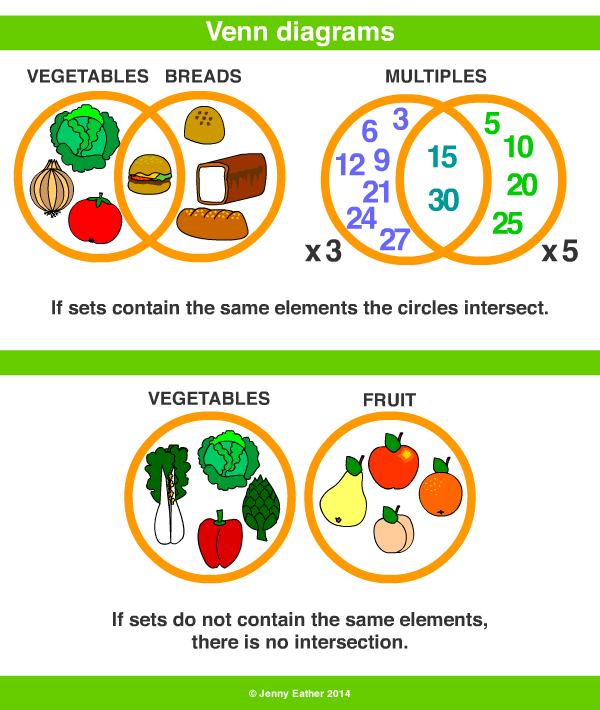
• a diagram using circles or other shapes, 
  to show the relationship between sets.

0% Complete